IBM Power CPU monitoring
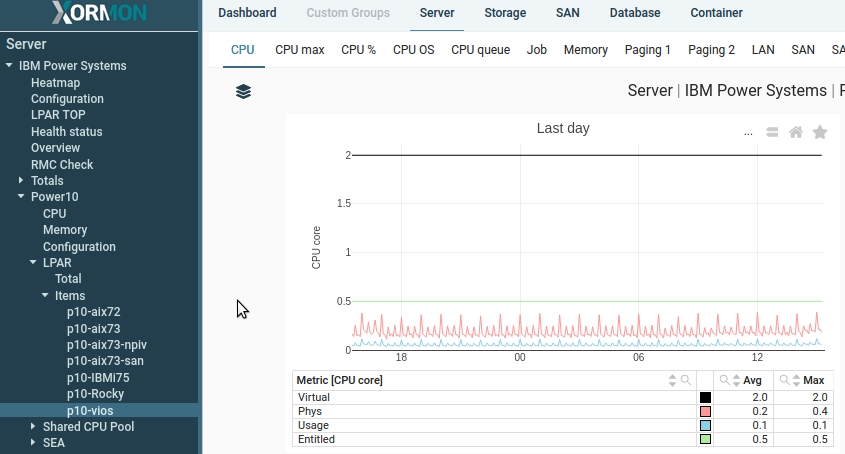
- CPU Phys: CPU physical allocation to LPAR, it is what you can see in LPAR2RRD
- CPU Usage: real OS level CPU utilization = "CPU physical" - "CPU idle cycles"
- CPU Virtual: number of virtual CPUs allocated for the LPAR
- CPU Entitled: entitled CPU allocated for the LPAR
 |
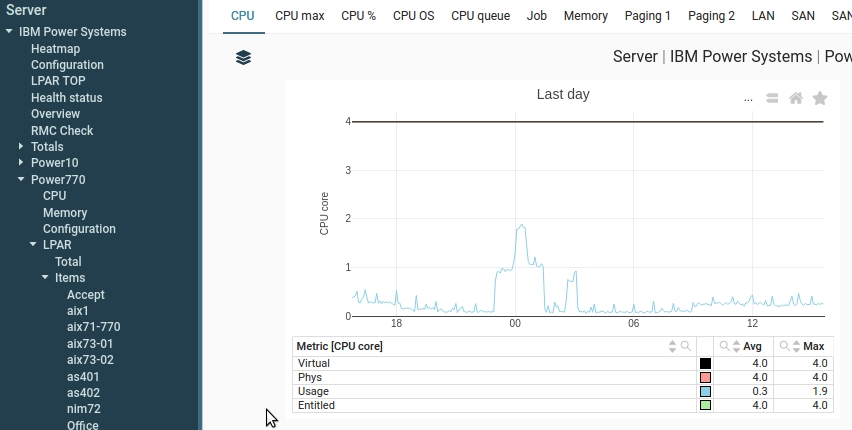
LPAR in CPU dedicated mode
If a LPAR is in CPU dedicated mode with keep idle procs then "CPU Phys" is equal "CPU Virtual" and it is a flat line in the graph.Similary server "CPU Phys" contains
LPAR CPU dedicated example
You can see that "Phys", "Virtual" and "Entitled" are flat lines, 4 Cores
 |
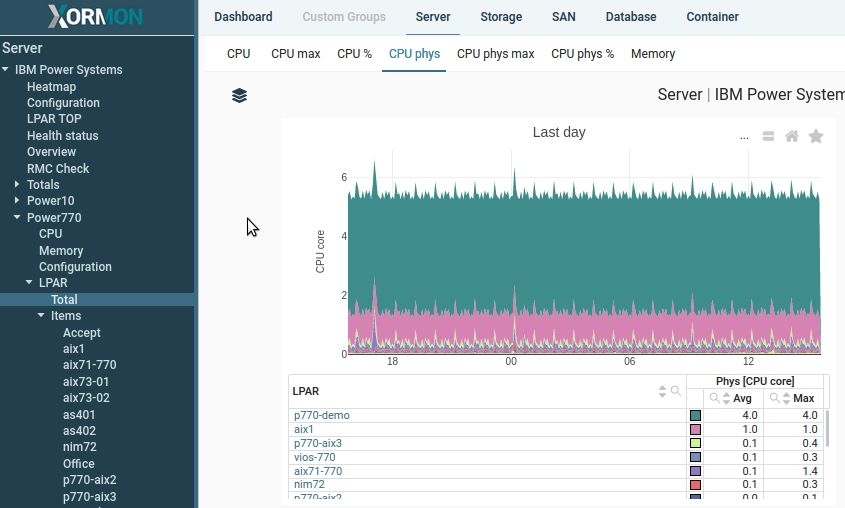
LPAR CPU dedicated: aggregated example
"CPU Phys" LPAR aggregated graph, you can see there same LPAR as above with 4 CPU cores
 |
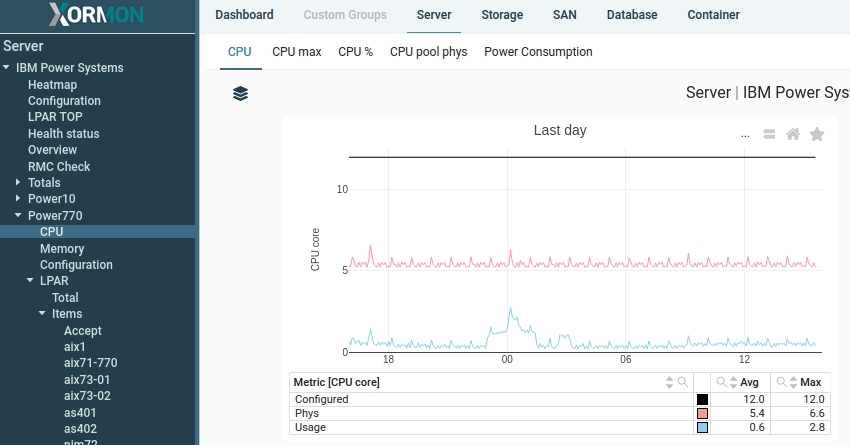
LPAR CPU dedicated: Server CPU Total
You can see that "Phys" is much higher than "Usage" due to a LPAR with 4 CPU dedicated in "keep idle procs" mode
 |