Alerting
You can create alerts based on performance data metrics for all configured devices.
Any metric that is collected by the tool can be selected for alerting.
Configure it via the UI ➡ Settings ➡ Alerting ➡ Configuration
Define email groups under "Email" tab at first.
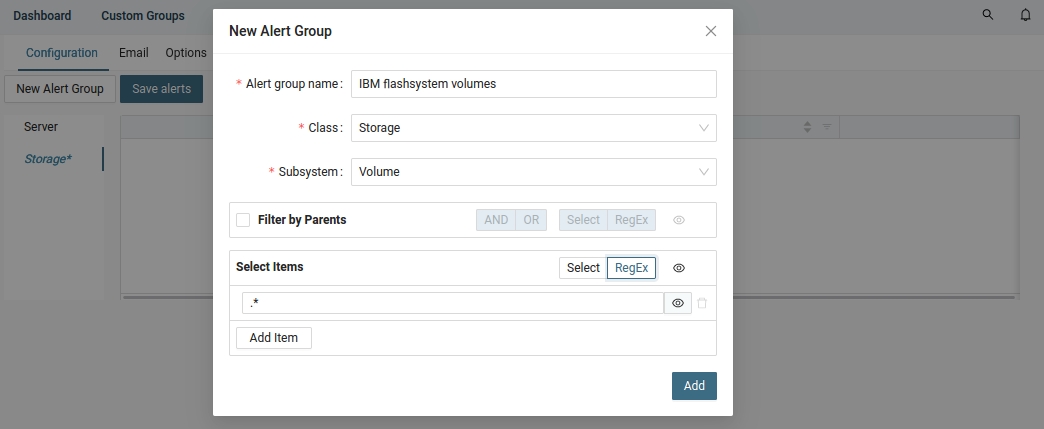
Put a name, select a class, subsystem (volume) and volumes here via regex ('.*' means all volumes on all storage devices) ➡ Add
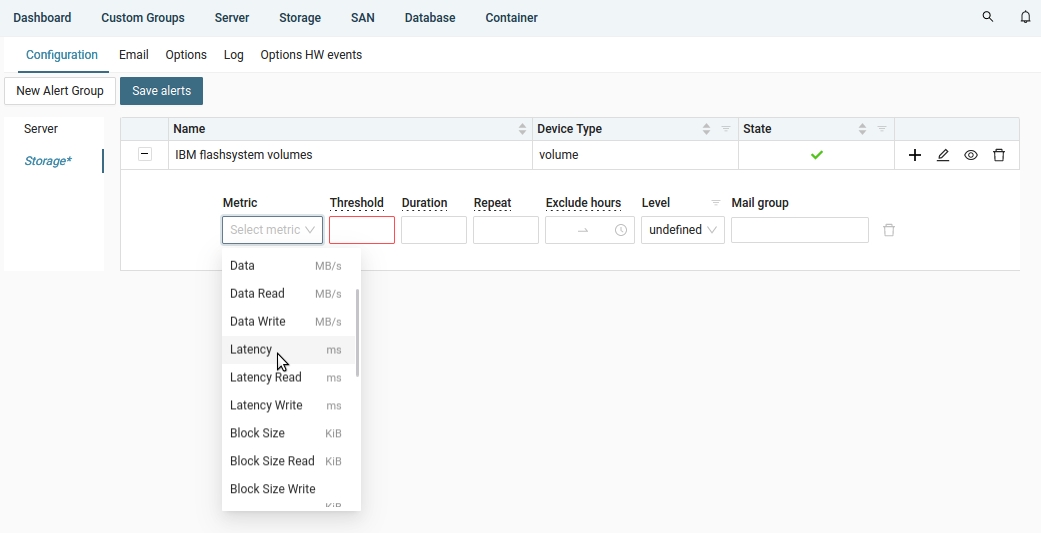
Select a metric (Latency)
Put threshold and email targed groups defined in advance ➡ Save
Then via a "+" sign in the alert line on the right you can add more metrics to be alerted for the same alert group.
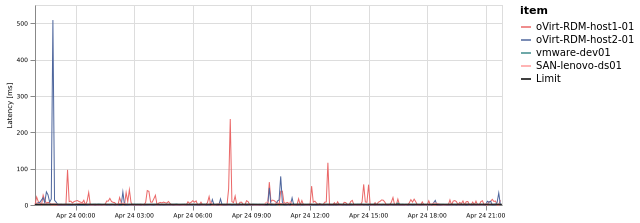
Storage email alert
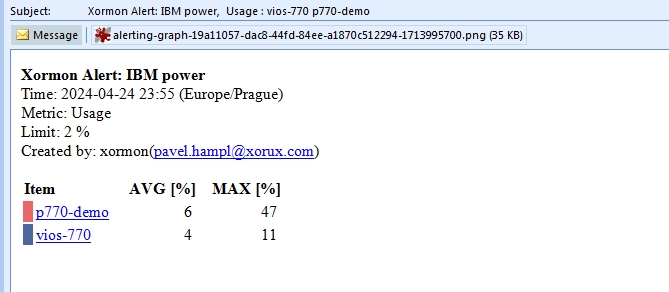
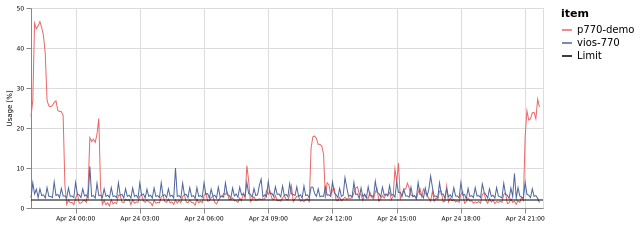
Server email alert
Any metric that is collected by the tool can be selected for alerting.
Configure it via the UI ➡ Settings ➡ Alerting ➡ Configuration
Define email groups under "Email" tab at first.
How to create a new dashboard
Storage-based alert: select "Storage" ➡ New Alert Group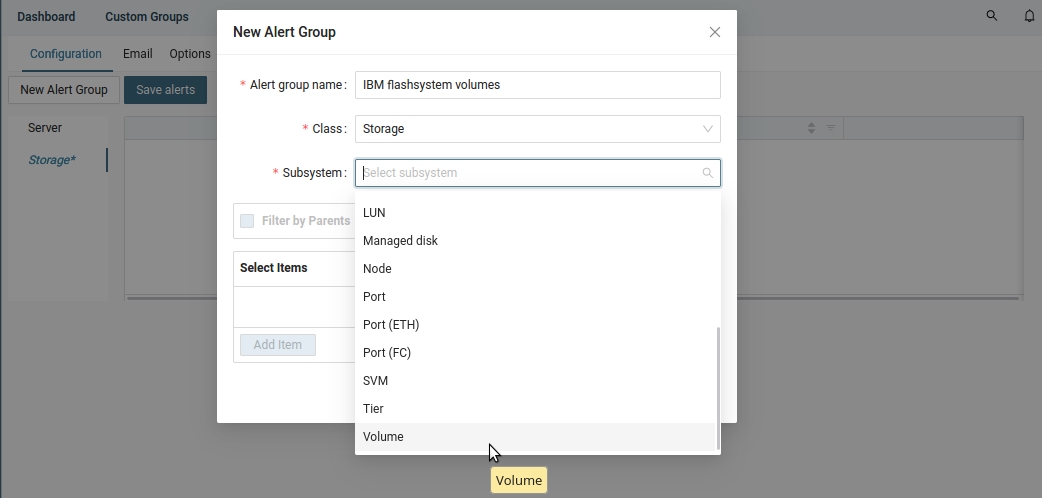 |
Put a name, select a class, subsystem (volume) and volumes here via regex ('.*' means all volumes on all storage devices) ➡ Add
 |
Select a metric (Latency)
 |
Put threshold and email targed groups defined in advance ➡ Save
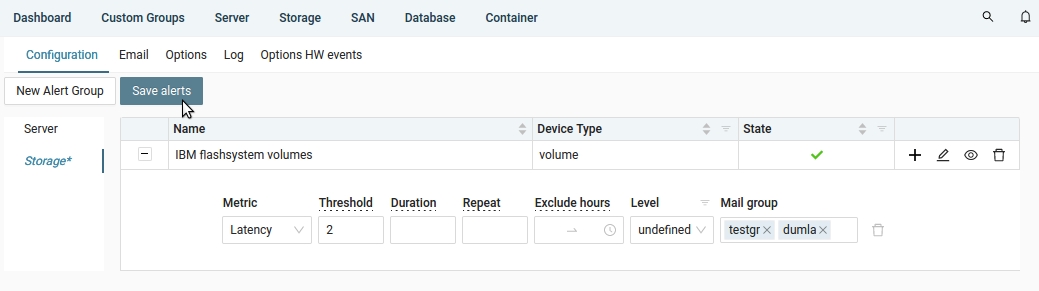 |
Then via a "+" sign in the alert line on the right you can add more metrics to be alerted for the same alert group.
Examples
Email alerts have included graphs by default, you can set your own time range of that graph in the Alerting Options tabStorage email alert
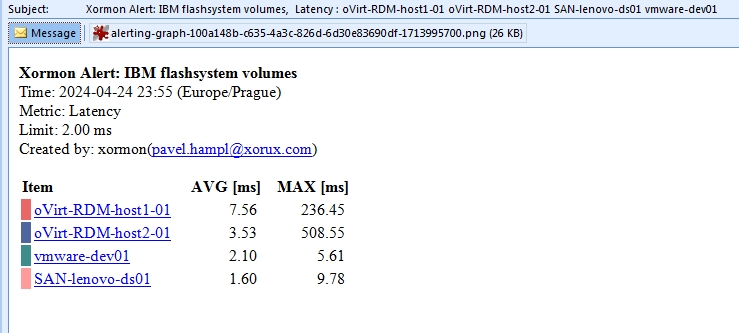 |
 |
Server email alert
 |
 |
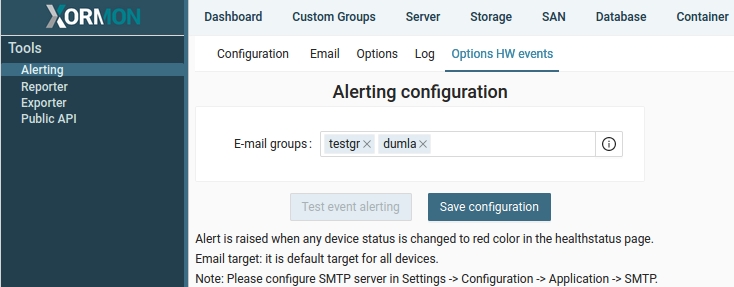
It raises an alert when any critical HW or SW error is detected for any devices.
Basically, the alert is sent when any device goes to the "red" status in the global health status dashboard.
Once a device goes back to "green", clear alert is sent.
You can configure via the UI ➡ Settings ➡ Alerting ➡ Options HW Event
Define email groups under "Email" tab at first.
Basically, the alert is sent when any device goes to the "red" status in the global health status dashboard.
Once a device goes back to "green", clear alert is sent.
You can configure via the UI ➡ Settings ➡ Alerting ➡ Options HW Event
Define email groups under "Email" tab at first.
 |
So far, only email is supported.
It will be extened by integrations with 3rd party soon to support at least same as in our original tools
It will be extened by integrations with 3rd party soon to support at least same as in our original tools
- AlarmsOne
- Service Now
- Riverbed NetIM
- HPE OpenView
- Jira
- Nagios
- SNMP Trap
- others can be done as needed