Overview
Navigate: UI ➡ Storage ➡ Overview: select storage devices and time range
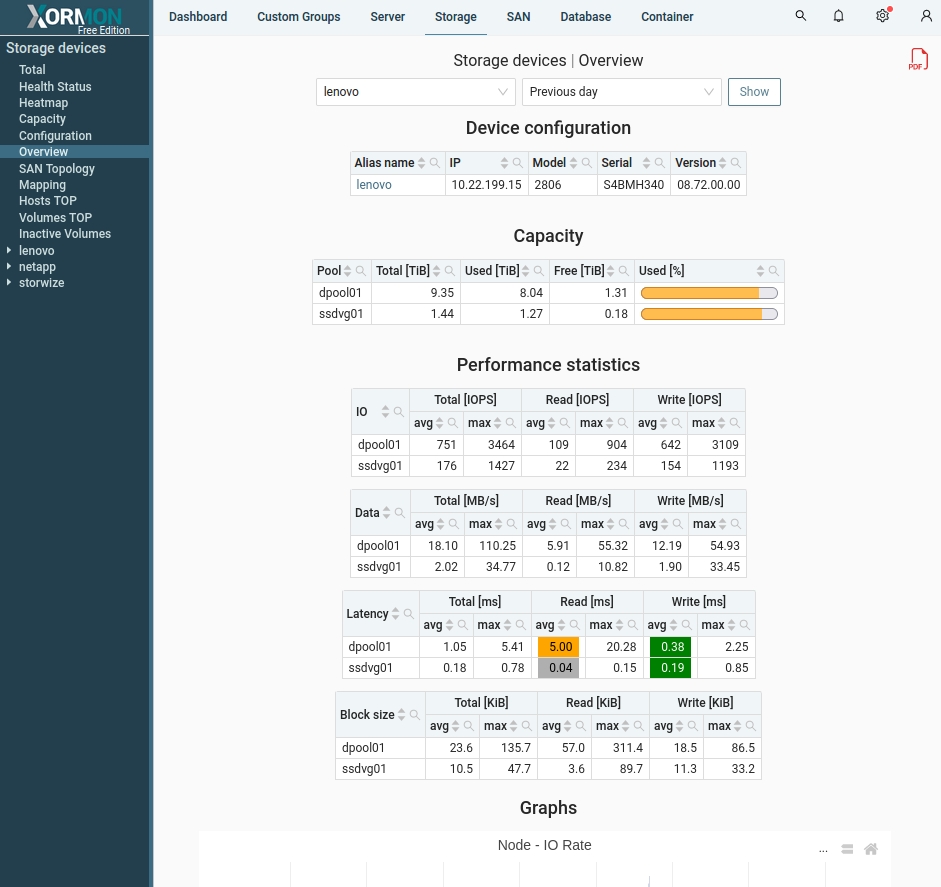
Capacity is reported per pool Performance part have 3 predefined time ranges (last day/week/month) with crucial metrics IOPS / Data throughput / Latency It can be downloaded as PDF or scheduled regularly from the reporter feature
Colors used for latency data in the table is based on the Heatmap feature.
PDF example:

 |