Enhanced Predictions
Our goal is to provide actionable insights for selected performance metrics. That is reflected in our approach - we provide several reasonably selected models which should together with administrators deeper knowledge of actions on the infrastructure enhance their monitoring capabilities.
Currently supported metrics are:
- Storage Pool Capacity Usage
- Virtualization Server/VM CPU Utilization
Prediction graphs include standard linear least squares trends with several advanced forecasting models.
Simplest and most performant models are based on seasonal extrapolation and elimination of statistical outliers.
Approach used for seasonal extrapolation is marked by keyword in name:
- robust - minimizes the effect of sudden random movements within data
- reactive-robust - minimizes the effect of sudden random movements and creates extrapolation based on reactive trends
- reactive - prioritizes effects of more recent behaviours
Other used keywords are:
- clean - indication that model directly uses some approach to remove outliers from original time series
- reactive trends - trends prioritizing more recent values
Method Guide
The following guide should equip user with intuitive understanding of two core methods - seasonal extrapolation and outlier detection/removal.Seasonal Extrapolation
All basic extrapolation methods are in principle very simple: we transform input time series via specific seasonal decomposition methods, compute seasonal interpolations and then under model-specific conditions extrapolate each component. Finally we combine them all into final result.You can see that approach in action for reactive-robust weekly extrapolation:
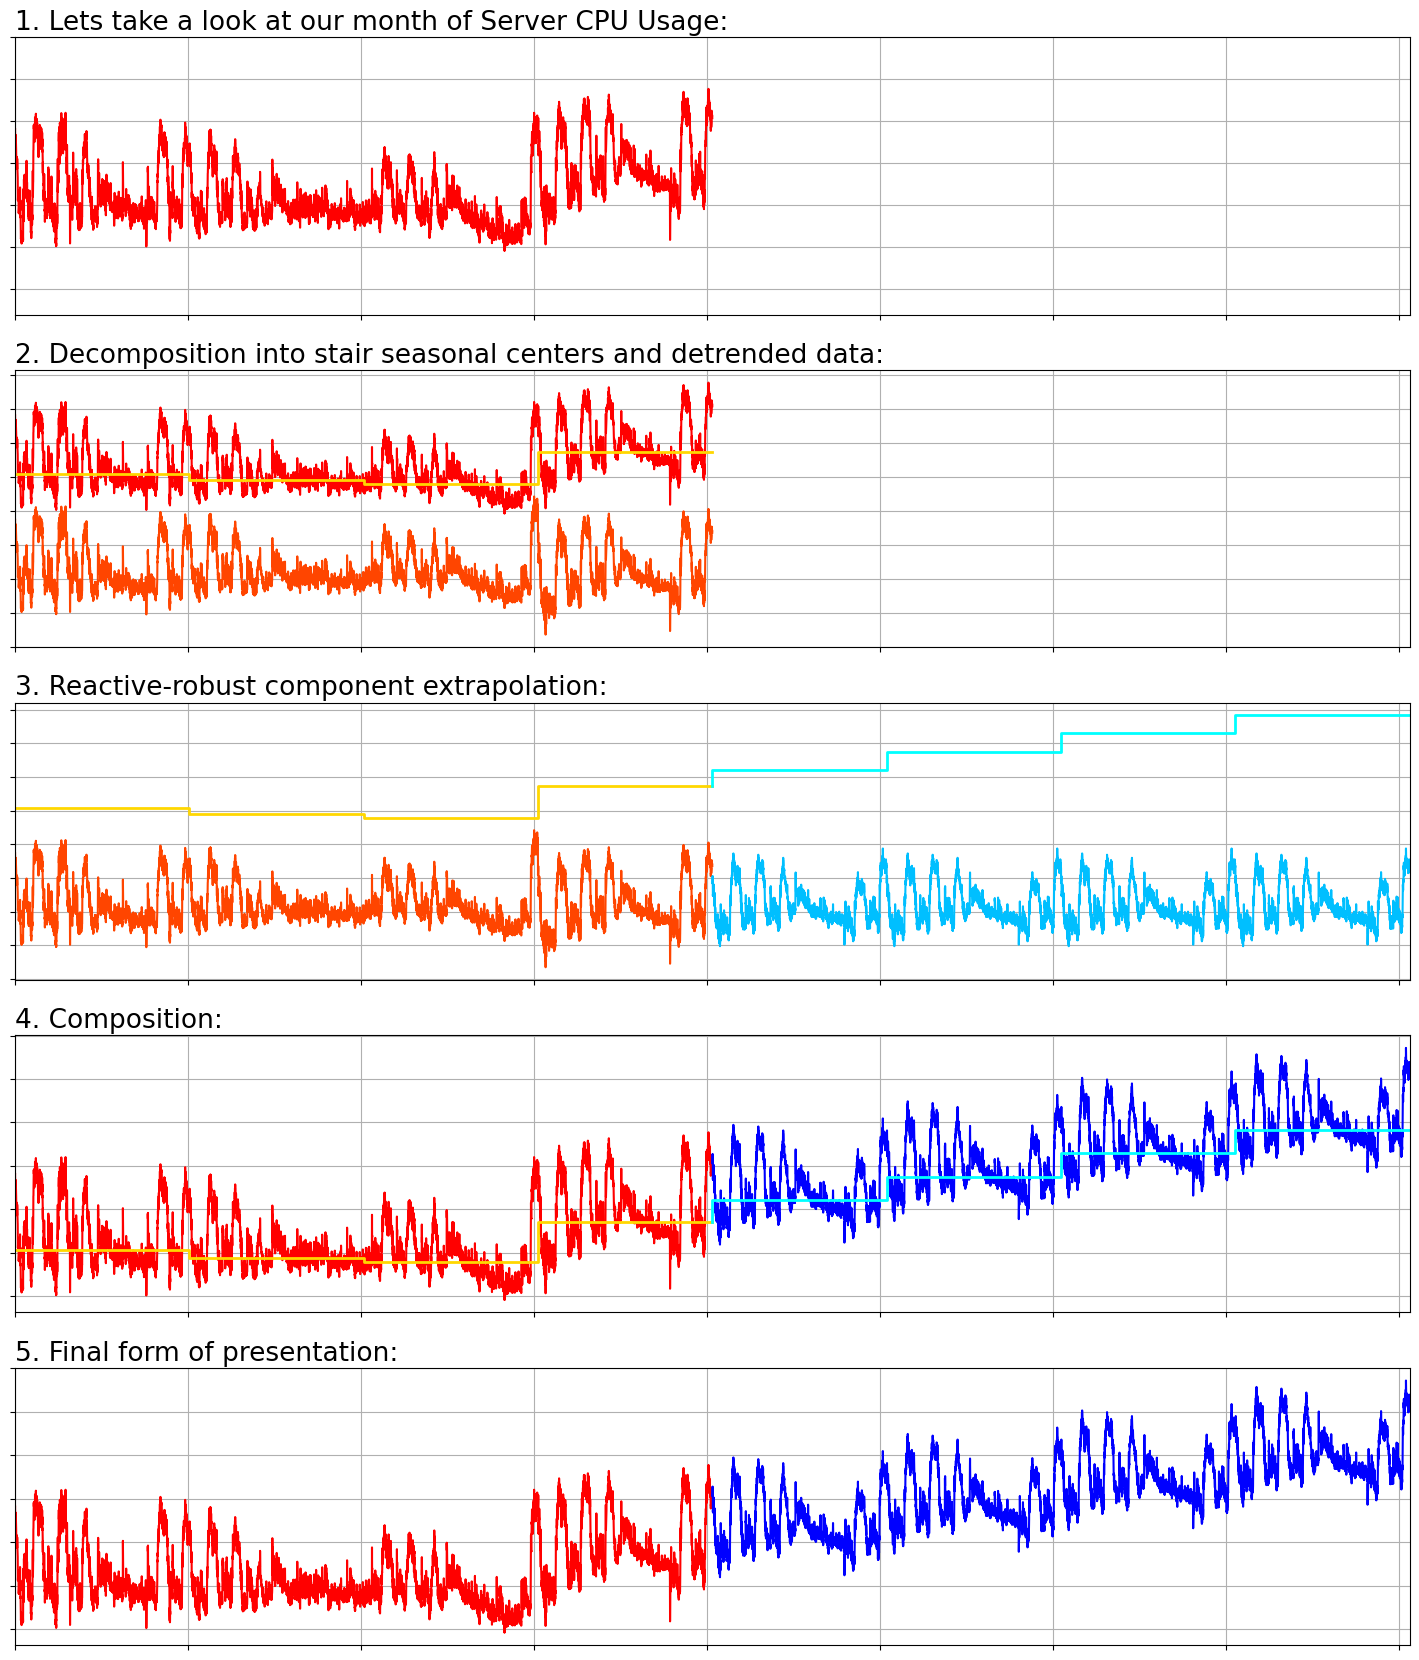 |
Outlier Detection and Removal
Another important concept to understand is the method of cleaning out statistical extremes. Steps of the simplest algorithm are following: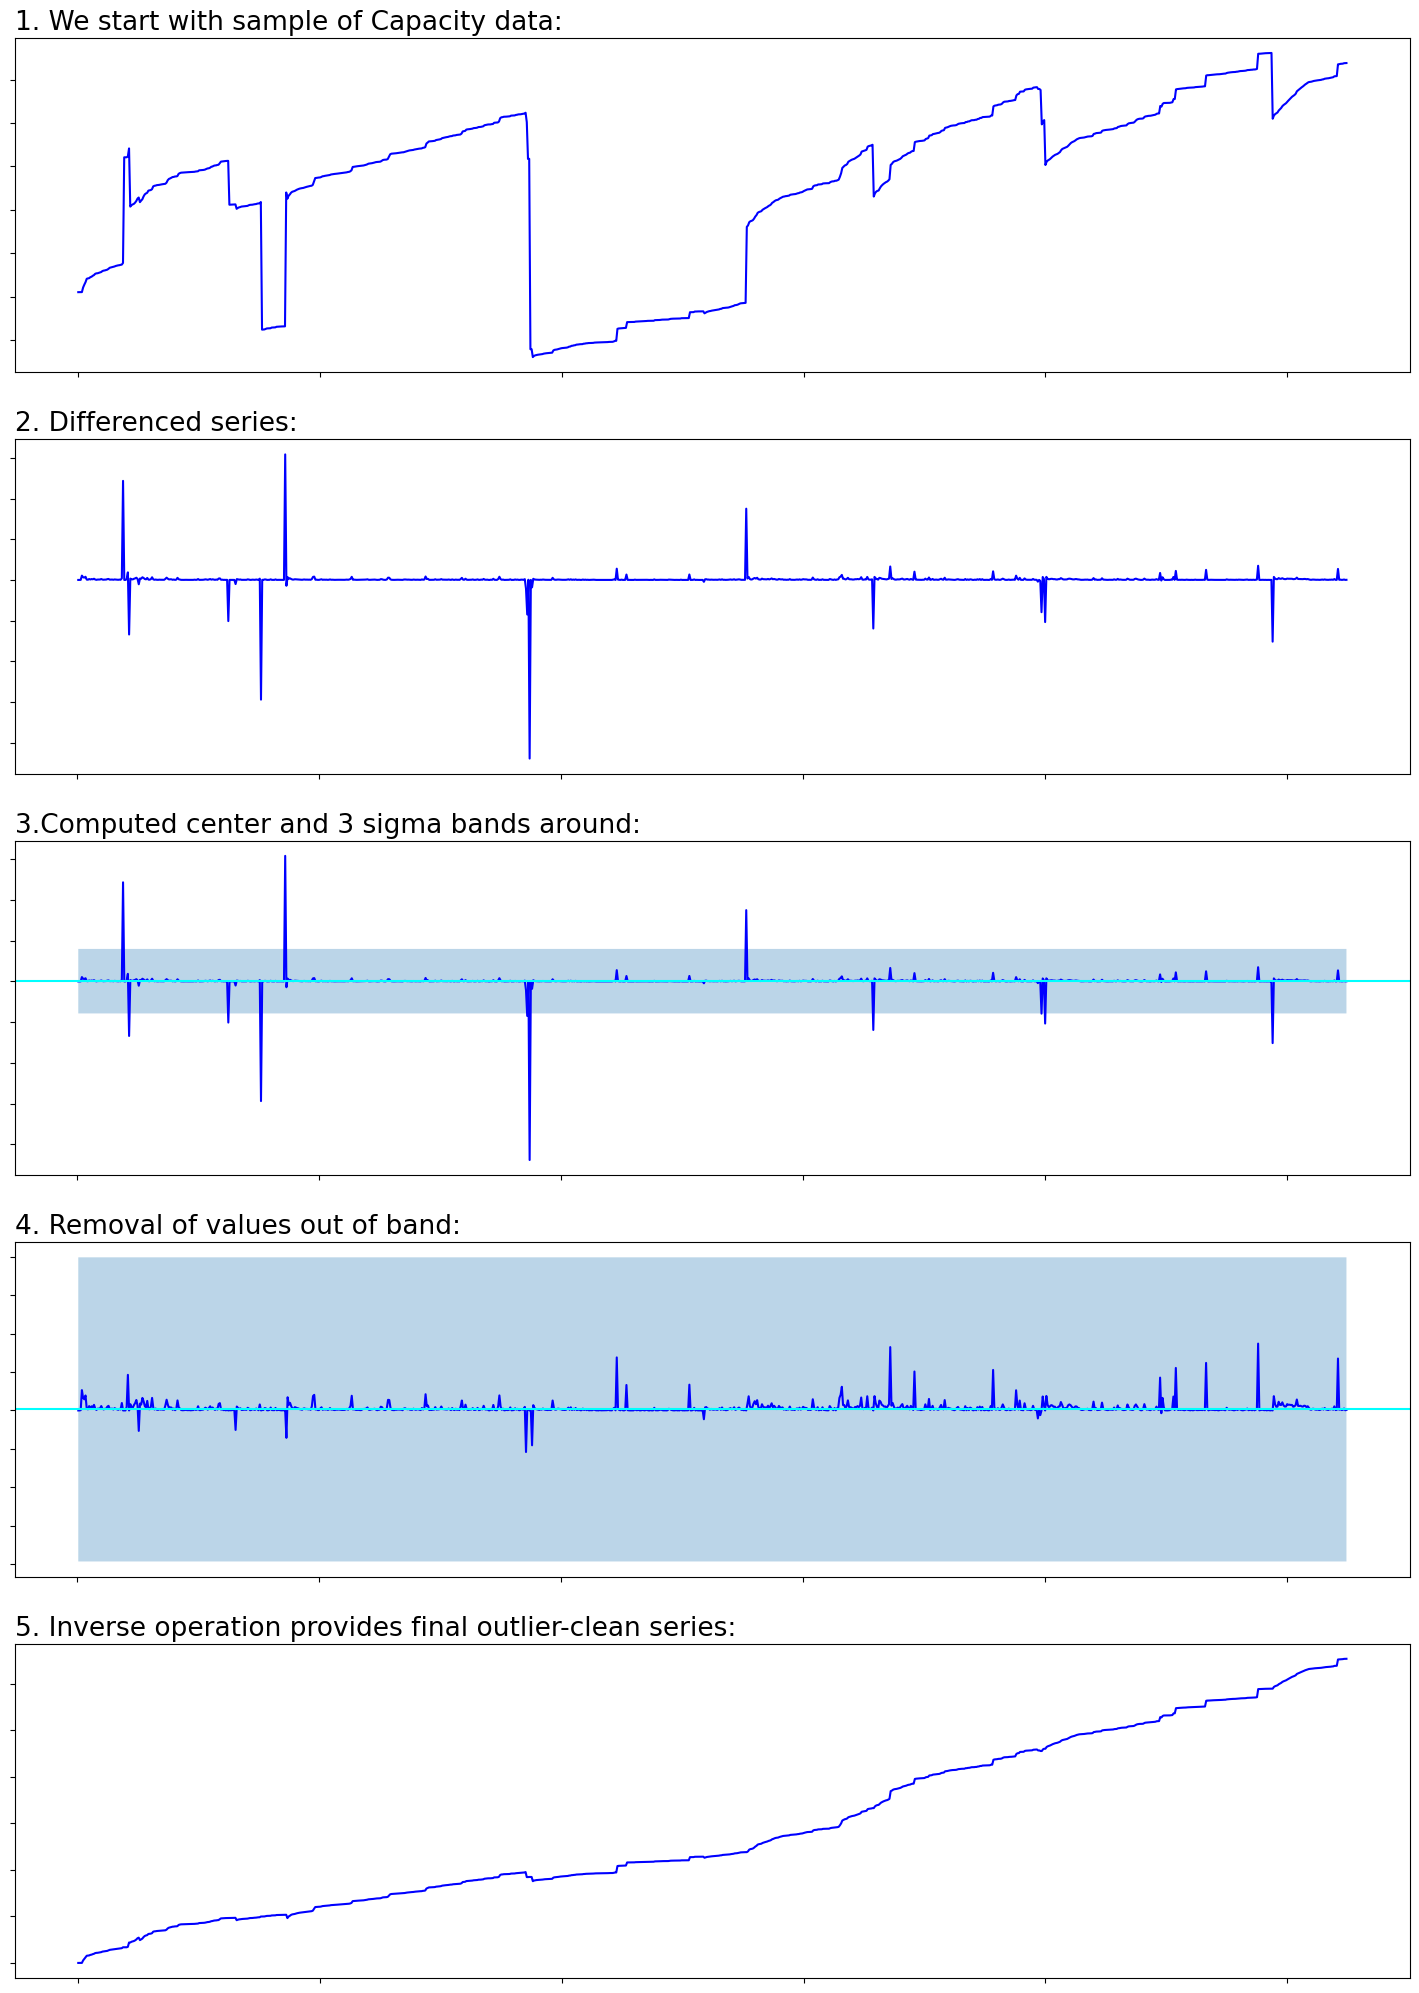 |
Default method uses 3-sigma rule on differenced series to remove the most extreme values. If model uses different cleaning algorithm, we would indicate it in its description.
Note that all plots were made using Python library Matplotlib.