Server Virtualization
RedHat Virtualization / oVirt / OLVM monitoring is not implemented yet in XorMon NG, we expect its support later in 2024.
So far you might use LPAR2RRD for its monitoring.
Do you want to let us know your priorities? Vote for your missing features and device support. More votes, bigger priority for us.
So far you might use LPAR2RRD for its monitoring.
Do you want to let us know your priorities? Vote for your missing features and device support. More votes, bigger priority for us.
XenServer / Citrix monitoring is not implemented yet in XorMon NG, we expect its support later in 2024.
So far you might use LPAR2RRD for its monitoring.
Do you want to let us know your priorities? Vote for your missing features and device support. More votes, bigger priority for us.
So far you might use LPAR2RRD for its monitoring.
Do you want to let us know your priorities? Vote for your missing features and device support. More votes, bigger priority for us.
Huawei FusionCompute monitoring is not implemented yet in XorMon NG, we expect its support later in 2024.
So far you might use LPAR2RRD for its monitoring.
Do you want to let us know your priorities? Vote for your missing features and device support. More votes, bigger priority for us.
So far you might use LPAR2RRD for its monitoring.
Do you want to let us know your priorities? Vote for your missing features and device support. More votes, bigger priority for us.
XorMon NG uses HMC REST API access via read-only user
It is supported on HMC v8+, use LPAR2RRD via CLI access for older HMCs
It is supported on HMC v8+, use LPAR2RRD via CLI access for older HMCs
-
Allow access from the XorMon NG host to all HMCs on port 443 TCP (older HMC might require port 12443 TCP)
-
Create xormon user on each HMC, read-only role, with password, set no password expiration
Use HMC local user account, not the domain one.
- Allow remote access via the web:
HMC v10: Menu ➡ User management ➡ User profiles ➡ xormon ➡ modify ➡ Properties ➡ Allow remote access via the web
HMC older:Menu ➡ Manage User Profiles and Access ➡ select xormon ➡ modify ➡ User properties ➡ Allow remote access via the web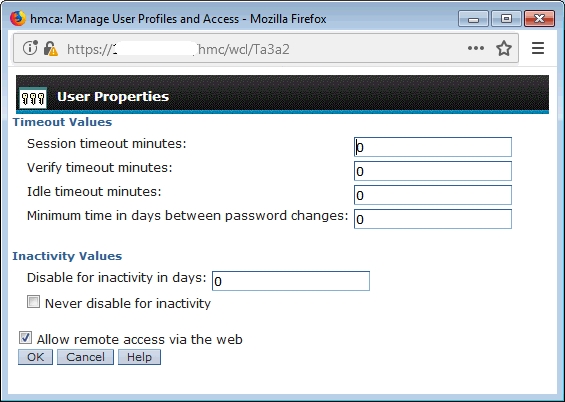
- Enable HMC LongTermMonitor. It is part of Performance Monitoring in HMC Workplace.
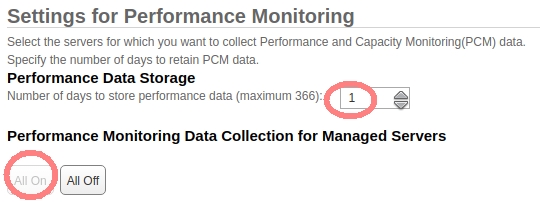
This performance monitoring can store up to 366 days of data. XorMon NG uses performance data only 30 minutes old so you can set the minimum number of days to store performance data (1 day).- HMC v10: Menu ➡ Performance dashboard ➡ System dashboard ➡ Turn data collection on
-
HMC v9:
HMC Management ➡ Console Settings ➡ Change Performance Monitoring Settings ➡ All on
Note: in case of HMC v10 you need to go into the "user settings", and switch to the old UI: Switch to old dashboard. After switching to the old UI, you’re able to navigate to the corresponding settings.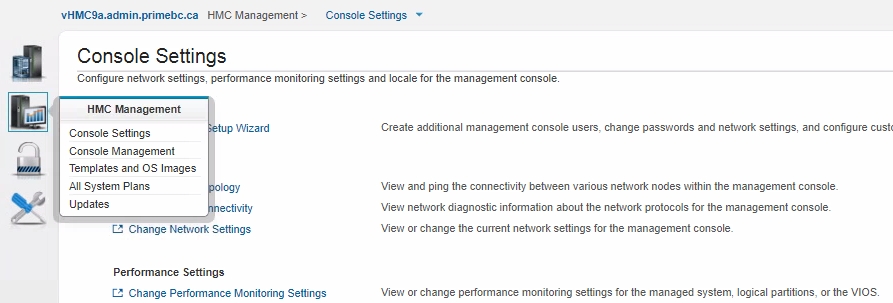
-
Setup on older HMC:
HMC Management ➡ Operations ➡ Change Performance Monitoring Settings ➡ All On
- Configure HMC access in the XorMon NG UI: Devices ➡ Server Virtualization ➡ IBM Power Systems ➡ Add

- Run "Test" for the HMC, it must show "OK"
-
Wait about 30 minutes, then refresh the web browser cache by Ctrl-F5
- Troubleshooting
- HMC v10: Menu ➡ Performance dashboard ➡ System dashboard ➡ Turn data collection on
XorMon NG uses vCenter REST API access via read-only user
-
Create a user xormon on each vCenter with read-only role.
It must be the global one (like below lpar2rrd user in xorux.com domain)

Assign xormon@xorux.com user read-only role
-
Allow access from the XorMon NG host to vCenter on port 443 TCP (https).
- Define VMware hosts (vCenter) in the XorMon NG UI:
Settings ➡ Device ➡ Server Virtualization ➡ VMware ➡ New ➡ place credentials (username in format: xormon@your_domain)

- Run "Test" for the vCenter, it must show "OK"
-
Wait about 1 hour, then refresh the web browser cache by Ctrl-F5
XorMon NG uses REST API access via 'View' user role
There are 2 options how to get data, both provide same data set:
There are 2 options how to get data, both provide same data set:
- Prism Central: connect just central host
- Prism Element: connect all hosts
- Allow access from the XorMon NG host to all Prism Element/Central hosts port 9440 (HTTPS)
- Create a user (preferably xormon) without any role (system will assign 'View' role by default).

- Attach Prism Element/Central hosts
XorMon NG UI ➡ Settings icon ➡ Device ➡ Server Virtualization ➡ Nutanix ➡ New ➡ Select Prism Central or Prism Element

- Run "Test" for configured Prism Central/Element, it must show "OK"
-
Wait about 1 hour, then refresh the web browser cache by Ctrl-F5
XorMon NG uses REST API access via 'View' user role
- Allow access from the XorMon NG host to Proxmox on port 8006 (TCP).
- Create a monitoring group


- Add PVEAuditor role to monitoring group


- Create xormon user under monitoring group


- Configure Proxmox host:
XorMon NG UI ➡ Settings icon ➡ Device ➡ Server Virtualization ➡ Proxmox ➡ New

- Run "Test" for configured Proxmox host, it must show "OK"
-
Wait about 1 hour, then refresh the web browser cache by Ctrl-F5
 |
XorMon NG gets data from Oracle VM Manager.
Supported is OVM 3.3 and 3.4.
- Allow access from the XorMon NG host to all Oracle VM Manager hosts ports 7002 (HTTPS)
- Users access
You have to use the admin user, because Oracle VM does not support role based access
You can create a different user if you wish (eg. 'xormon'), but it must have admin rights anyway.
- Attach Oracle VM Manager hosts
XorMon NG UI ➡ Settings icon ➡ Device ➡ Server Virtualization ➡ Oracle VM ➡ New

- Run "Test" for configured Oracle VM host, it must show "OK"
-
Wait about 1 hour, then refresh the web browser cache by Ctrl-F5